Oftentimes a question will ask for intervals of increasing and decreasing intervals. What it asks for is a chart. In this chart you will have included:
- Critical Values The boilerplate chart looks as such:
| Interval | x < ? | ? < x < ? | ? < x < ? | … | ? < x |
|---|---|---|---|---|---|
| f(x) | +/- | +/- | +/- | +/- | |
| slope | +/- | +/- | +/- | +/- | |
| change in slope | +/- | +/- | +/- | +/- |
We don’t make x = anything. Because you cannot have a change in slope at one point.
f(x)
SImply see if the function is above the x-axis or not
Slope
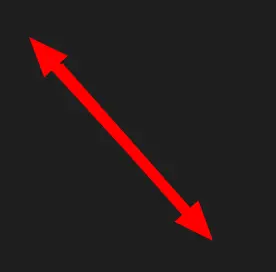
Negative slope looks like this:
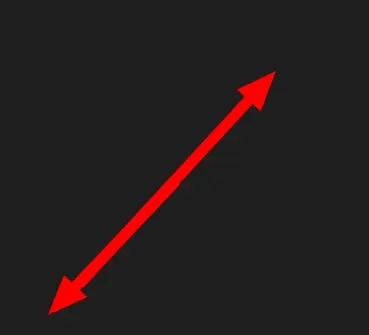
 Positive slope looks like this:
Change In Slope
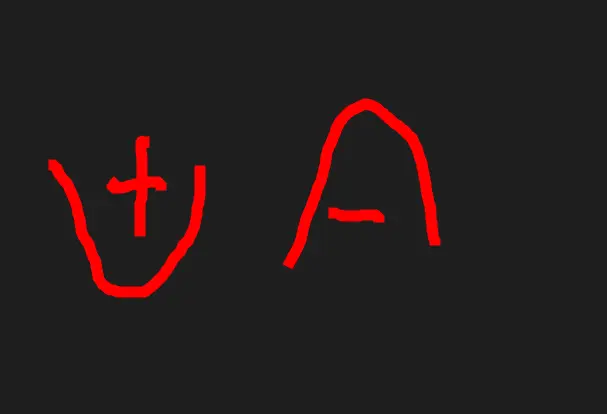
A smiley is positive
A frown is negative
Example
So we may have a reciprocal function with the equation: We need to find the Critical Points and the X Intercept
X intercept
Critical Points
Before we Chart, we must graph it
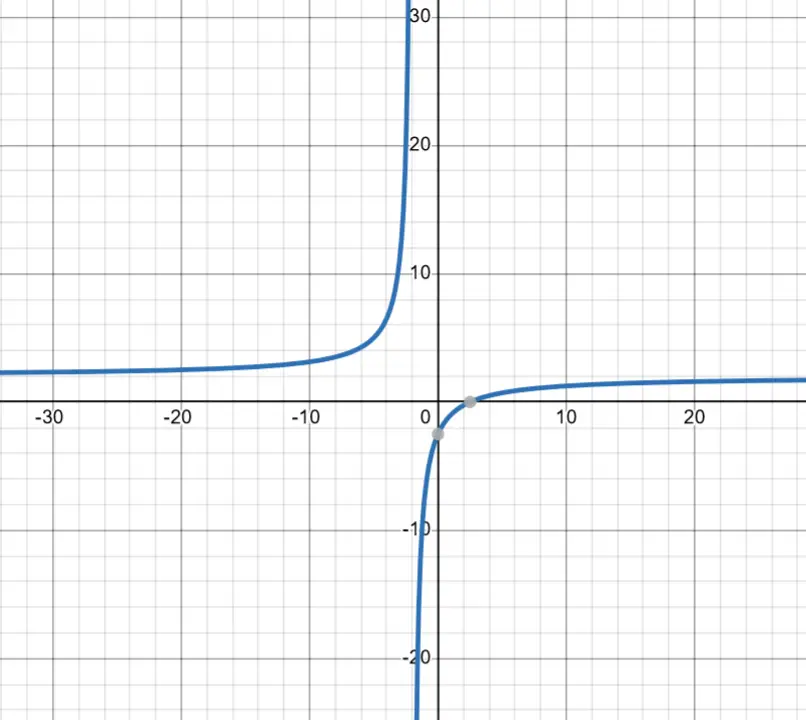
Charting
Our points are 5/2 and -2
| Interval | x < -2 | -2 < x < 2.5 | x > 2.5 |
|---|---|---|---|
| f(x) | + | - | + |
| slope | + | + | + |
| change in slope | + | - | - |