Table of Contents
Exponential Function
An exponential is a function in form of y=b^x, b>0 and
- has a repeating pattern of finite differences
- rate of change(increasing) that is proportional to the function for b>1
- rate of change(decreasing) that is proportional to the function for 0<b<1
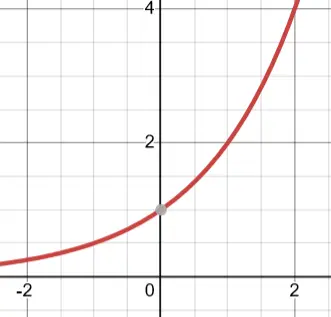
Growth Example
Graph
Table of Values
| x | y |
|---|---|
| -2 | 1/4 |
| -1 | 1/2 |
| 0 | 1 |
| 1 | 2 |
| 2 | 4 |
Graphing
Special Properties
| y=2^x | |
|---|---|
| Domain | x ∈ ℝ |
| Range | y > 0 |
| y-intercept | (0,1) |
| Asymptotes | x=0 |
| Increasing or Decreasing | Increasing |
Decay Example
graph
Table of values
| x | y |
|---|---|
| -2 | 9 |
| -1 | 3 |
| 0 | 1 |
| 1 | 1/3 |
| 2 | 1/9 |
Graphing
We are decaying
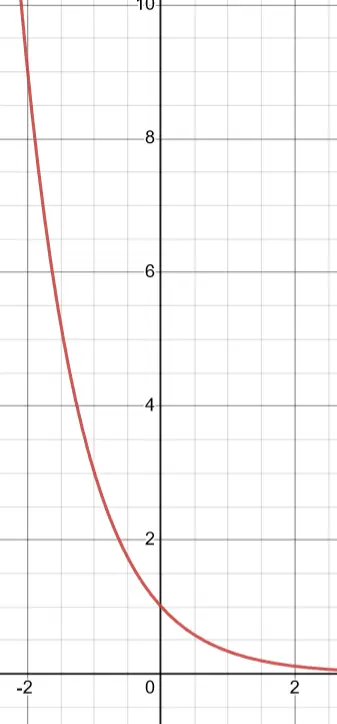
Decay And Growth Relation
Notice the similarity between and Its a flip on the y axis
Growth Factor
to get the growth factor (or the base) from the table of values
Scale_differences
| x | y | |
|---|---|---|
| -2 | ||
| -1 | 3 | |
| 0 | 1 | 3 |
| 1 | 3 | 3 |
| 2 | 9 | 3 |
| If you find the scale from one value of y to the other, and they are all the same, you will find the base. |