Search
❯
Nov 12, 20251 min read
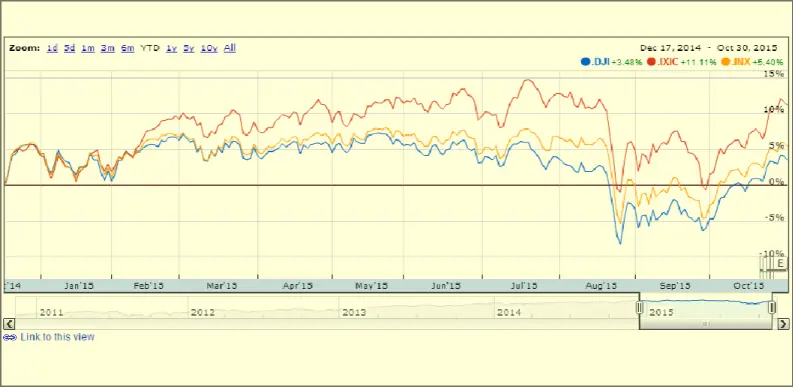
Visualizing Time Series Data by creating a 2D plot of the time graph.