Search
❯
Jan 10, 20261 min read
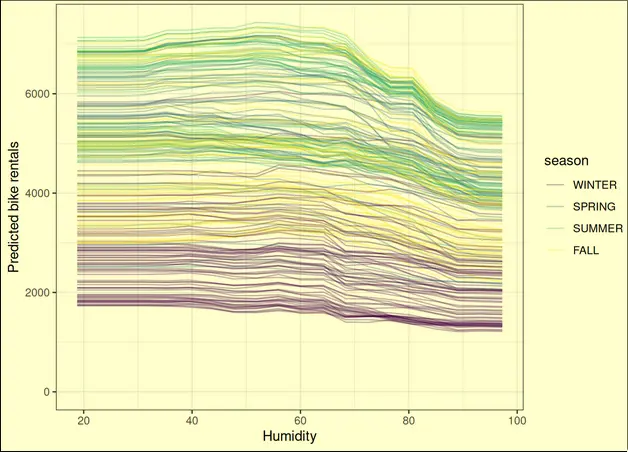
Plots the display of how one instance’s prediction changes when a feature changes.